Search
Thanks to Research Officer Samuel Beecher for sharing the results of Catholic Relief Services’ multi-year mobile research into their Savings and Internal Lending Community (SILC) groups with help from digital financial diary tools. Below is a high-level summary, but we encourage you to watch the recording, where Samuel provides many more details about the data and analysis.
CRS’s EFI program’s core goal is to expand financial inclusion to poor and vulnerable households by forming Savings and Internal Lending Communities (SILC) groups, with an aim to create 19,200 new SILC groups with 502,320 members. EFI Africa has reached over 500,000 households in Burkina Faso, Senegal, Uganda, and Zambia since its inception.
Each SILC goes through these standard activities:
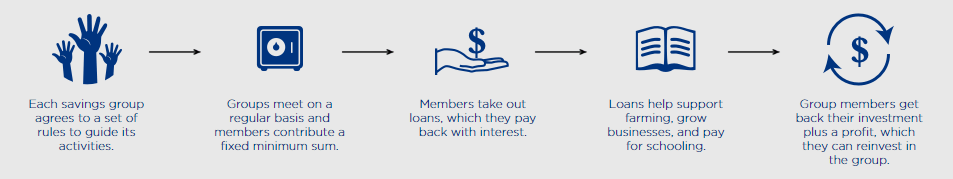
After 8-12 months, participants can receive a share-out, which is their savings and the interest they’ve earned.
CRS’ Expanding Financial Inclusion Africa group has asked research questions to measure and determine effectiveness of their programs over the past 4 years. They wanted to answer 2 main questions:
EFI staff and local partners would collect the PPI over 4 years in all 4 countries, and the digital financial diary tools over 2 years in Zambia. They originally started collecting on pen and paper but realized they needed a faster way to get large amounts of data and to put more data in the hands of the staff.
For in-country field staff, they needed an offline mobile app, the ability to see pre-populated data in the app, and access to both the mobile and cloud-based back-end system. For regional staff who are working across multiple countries, they wanted the ability to record GPS coordinates in order to create storymaps, to customize surveys, to have stronger and quicker feedback loops, and to monitor data at different levels.
To meet these requirements, they chose TaroWorks to digitize the PPI and financial diary information, and connect all the data in the Salesforce.com cloud database.
To answer this key learning objective, EFI used the Progress out of Poverty Index, which is a country-specific scorecard of 10 questions, that estimates how likely a household is to fall under a particular poverty line. In order to standardize the results from across the program countries, they looked at the $1.25 poverty line for all countries.
They started by collecting reference data in the areas they targeted for creating SILC groups, but where SILC groups did not yet exist. Consultants were sent to conduct randomized PPI surveys in villages before any SILC groups were formed (baseline). Once SILC groups were created, the PPI surveys were administered to the members as well.
In total, they compared PPI information in 4 countries, 10 regions, 198 villages, 616 SILC groups, and 24,926 PPI interviews.
They used 2 approaches to compare the results:
Comparing the means across the entire country of SILC groups and against national average PPIs.
Compared to the PPI’s national averages for any poverty line, they saw that across the board, SILC groups are likely comprised of a higher percentage of the very poor than what is the average representation across the country.
Within-village comparison of the SILC group PPI to the median baseline PPI score, by country and partner.
Partners might oversee different regions or villages, so another way EFI looked at the results was to compare each partner’s local PPIs against the baseline village results from before SILCs were formed. They saw that each partner might have different levels of success reaching a poorer population than the average (equal, better off, or worse off than the baseline). They can also see how well off each village is compared to each other.
Does participation in SILC lead to improved economic outcomes for participating households? EFI sought to answer this question by conducting a longitudinal digital financial diaries study in Zambia. As a comparison, they conducted digital financial diaries interviews on households who didn’t participate in a SILC as well.
Overall, 14 enumerators logged digital financial diaries interviews between August 2014-October 2016, covering 7 villages in Northern Zambia, 270 households and 444 respondents. Participants were given a paper logbook to log transactions throughout the week and they would go through each line item at the end of the week with the CRS enumerator on their TaroWorks app. These interviews logged 2,000-3,500 transactions each week, for 200,000+ total transactions.
They used 5 question types as a guideline for capturing information about each transaction:
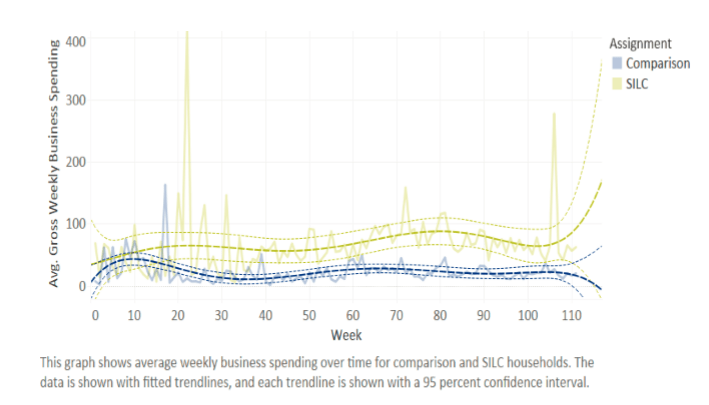
SILC households increased business spending over the course of the study
Over the study period, SILC households spent more on their businesses than comparison households, even though the amounts are still relatively small sums (~$10-$40 USD per week). Over time, the amount spent on their business increased slightly, whereas the comparison household investments in businesses remained stagnant.
There was no difference between SILC and comparison household net incomes over the course of the study
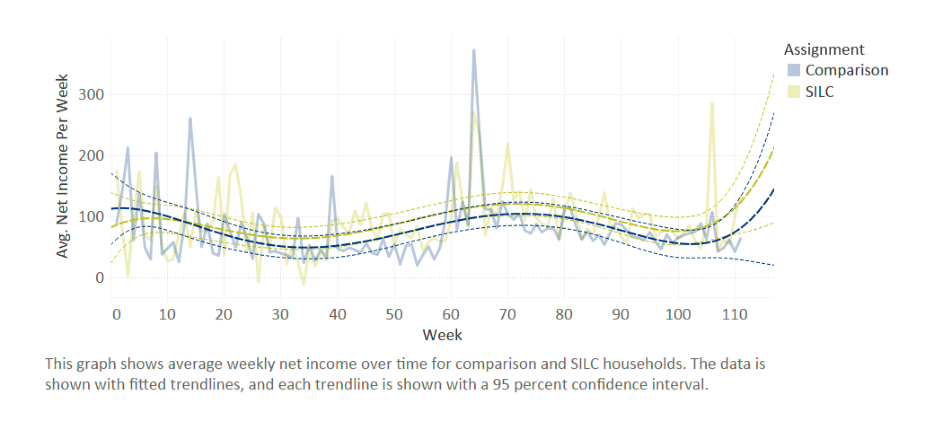
The net-income data shows variability week-to-week and some seasonality. However, the slow increase in business spending did not necessarily yield increased net incomes for the households. One explanation might be that the exchange rate for the Zambian Kwacha fluctuated between 5 and 14 Kr:USD. This effect might be especially acute because many of the households work in agriculture and trade, and the cost for inputs can be affected by the exchange rate.
More research will need to be done around the correlation between increased business spending and net incomes.
Only 1.3% of transactions were performed with a financial service provider
Given the marginalized nature of these households, CRS researched how they accessed financial services. The most commonly used financial tool are “self-provided,” meaning they take leftover cash and keep it at home for use – the equivalent of a checking account in more developed economies. “SILC services” which include savings deposits and loans, came in second. Households used “informal financial services” at almost the same frequency as SILC services, including cash gifts, or loans from friends. Informal financial services were used slightly less often.
SILC didn’t replace informal financial tools, but it provides a supplement to the existing tools. One difference CRS learned from in-depth interviews with 42 households is that SILC tools seem to be used more for business purchases and investments, whereas informal tools were more for building social capital (cash gifts, lending to friends).
What CRS didn’t see much of were transactions through formal financial tools. When households did go to formal financial providers, it was for receiving remittances or cash gifts via a mobile money operator. Without SILC, these households would be financially excluded except for existing social mechanisms.
SILC households consistently used both SILC savings share-outs and loans to manage cashflow
The average value of the saving deposits varied over time, but CRS saw that by the end of the study, households were depositing larger amounts. Share-outs were on average USD$80, which is 8x more than what a regular household received weekly. Groups tend to schedule share-outs for a time when it’s most needed, for example right before rainy season so they can purchase agricultural inputs, or to make school fee payments.
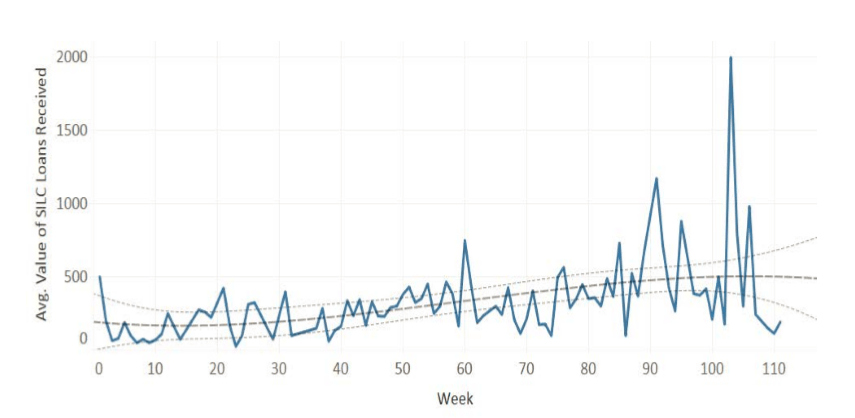
Likewise, loan sizes increased over the course of the study, and was on average USD$40 – 5x the amount they would have received had they used informal financial services (friends and family). The data also showed that households were more likely to take out a SILC loan in a deficit week (a week which they spent more than they earned) and the same in-depth interviews mentioned above revealed that SILC loans were an important financial tool to help households manage irregular income streams.
SILC households used their savings and loans to double the frequency with which they made outlier expenditures
CRS calculated outlier expenditures as unusually large purchases (2.5x the standard deviation) specific to the household (the threshold might be a $5 purchase for an extremely poor household, whereas it might be $50 for another).
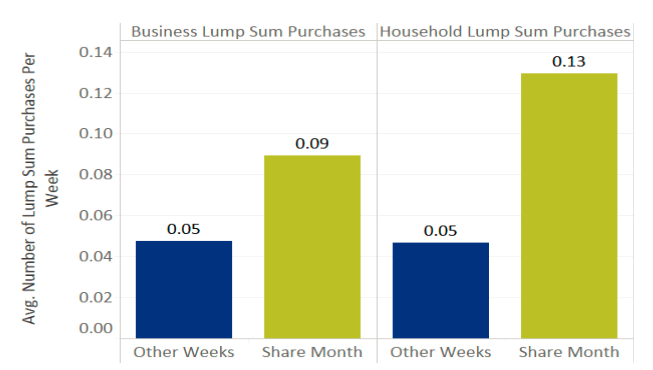
The data shows that there are more outlier purchases made when there is a share-out week, vs. a regular week. Households doubled the frequency of business purchases (ag inputs, materials, merchandise) while they almost tripled household expenditures (educations, assets such as mattresses).
By using the TaroWorks mobile app for the interviews, CRS were able to:
Some challenges they faced:
For more information and details about the research results, please reach out to Samuel Beecher at Samuel.beecher@crs.org
If you’re interested in adding digital financial diary tools to your operations, please reach out to your TaroWorks representative or to hello@taroworks.org.
POST TOPICS
Elaine’s background in marketing research and data analytics has shaped her goal of helping organizations use insights from better data to create positive change in communities. She has a BS in Marketing and Finance from New York University, and an MBA from the University of Michigan. Elaine is based in Washington, DC.
Sign up to receive emails with TaroWorks news, industry trends and best practices.
TaroWorks, a Momentum company.
Site by V+V