Search
“Data can be used as either a rearview mirror or as headlights. Successful organizations are using it as a headlight,” observed my colleague Elaine Chang when talking about data analysis methods during a recent webinar on using Salesforce.org Nonprofit Cloud platform for continuous improvement.
At TaroWorks, a Salesforce.org partner, we find that a growing number of nonprofits and social enterprises want to use data analysis methods to spotlight future nonprofit program management opportunities and challenges, in addition to evaluating what’s already happened. The problem is: nonprofit program managers either lack the knowledge or the tools to expand their focus.
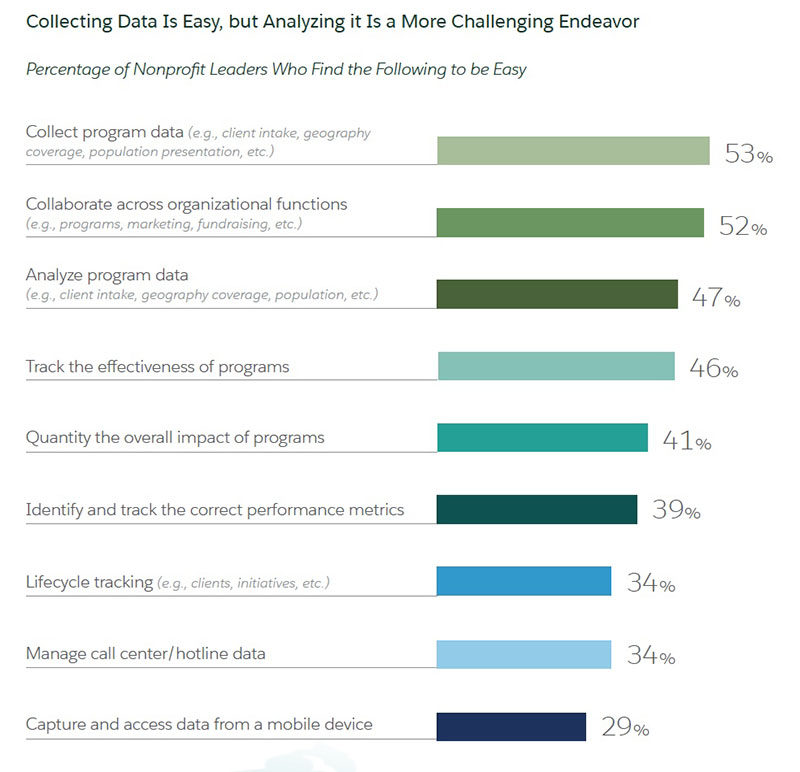
They’re not alone. The Salesforce.org 2018 Nonprofit Trends Report polled more than 450 nonprofit leaders, 53% of whom found it easy to collect program data. The challenge was putting the information to use as fewer than half (47%) of the respondents said it was easy to analyze that same data and only 39% said they had identified and tracked the correct performance metrics. Nonprofits may not know how to take advantage of the latest innovations like artificial intelligence, while the amount of data in the world (and in your programs) is increasing every year.

TaroWorks helps organizations with field agents use Salesforce to extend their work into some of the most challenging areas of the globe. We support social enterprises and nonprofits in more than 40 countries in the Global South – where infrastructure like wifi, electricity and running water are not guaranteed to be available 24/7, if at all. Additionally, social changemakers we serve operate in areas with staff who in many cases lack the digital literacy to use traditional Salesforce tools. They also face all the normal challenges that can kill any IT project, like budget constraints, data silos, and no advocate to champion the cause.

Despite the challenges, however, some of our clients use data in sophisticated ways through various data analysis methods. So how did they evolve from looking in the data rearview mirror to a shining a data headlight on the road to intelligent mission delivery?
Several decades ago, John Gall postulated a law of systems stating that “A complex system that works is invariably found to have evolved from a simple system that worked.”
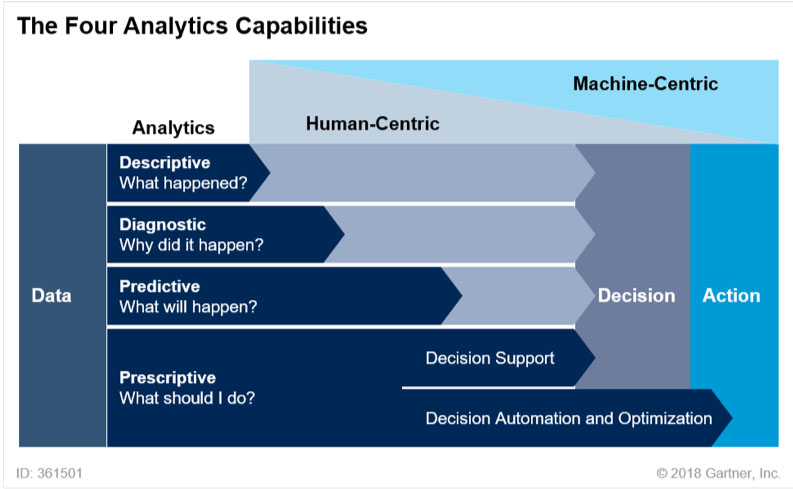
In fact, organizations make more sophisticated use of data over time. Research and advisory firm Gartner, Inc. illustrates this evolution in a four-stage framework (included in its October 5, 2018 “2019 Planning Guide for Data and Analytics”) which we think is applicable to nonprofit and for-profit enterprises. Data analysis capabilities begin as descriptive (What happened?) and diagnostic (Why did it happen?) but progress to predictive (What will happen?) and prescriptive (What should I do?).

We also think Gartner points to an imbalance in the way data at all four analytics capability levels is analyzed and distributed through organizations.
“Although Gartner estimates that a vast majority of organizations’ analytics efforts (and budgets) are spent on descriptive and diagnostic analytics, a significant part of that work is now handled by business users doing their own analysis,” according to the Gartner planning guide. “This work often occurs outside the realm of the sanctioned IT data and analytics architecture. Predictive and prescriptive capabilities, on the other hand, are usually focused within individual business units and are not widely leveraged across the organization. That mix must change.”
When TaroWorks first meets most organizations, they are in the descriptive and diagnostic stage of data analysis. Often, they start their evolution in data analysis methods by deploying the Salesforce.org Nonprofit Cloud and then adding TaroWorks mobile field service app from the AppExchange.
Here is one client that used powerful analytics tools from TaroWorks and Salesforce.org to analyze data in a less descriptive and more prescriptive way.
Sustainable Organic Integrated Livelihoods (SOIL) is a nonprofit research and development organization designing and implementing a social business model for providing access to a safe, affordable and dignified sanitation service that produces rich, organic compost as a natural resource for Haiti’s badly-depleted soils as well as economic opportunities for its citizens.
For a small monthly fee, SOIL supplies in-home container-based toilets to 1,000 Haitian households and services them on a weekly basis. In 2018, it safely treated and transformed nearly 500 tons of waste into compost that is used to support agriculture and reforestation efforts throughout the country.

Challenge: SOIL’s field agents first used pen and paper to log sales, toilet installations, weekly servicing and other business activities and then transcribed the information into spreadsheets. As their customer base grew, it became clear their ability to scale operations, link distributed data and make business decisions in real-time was limited by their lack of an integrated, flexible and mobile data management system. Lastly, SOIL needed its mobile field services tool to function in areas where mobile phone data service and internet connections were limited or unreliable and field agents speak Haitian Creole.
Solution: SOIL uses TaroWorks’ offline mobile CRM capability to provide company payment collectors access to a customer’s payment history and to conduct market research surveys. Salesforce data visualization dashboards give SOIL’s managers powerful business insights into the most effective sales and marketing techniques. Read more from TaroWorks.
These Salesforce reports and dashboards helped SOIL gain new insights about their sales and marketing tactics. For example, SOIL conducted customer research on which offers drive the most toilet sales. In one experiment, SOIL customers in some areas preferred receiving bonuses for referring new customers — in toilet paper rather than cash. SOIL used that insight to identify similar neighborhoods and uses hygiene products as incentives in those areas. SOIL data analysts also discovered that their customer responded more to time-limited discounts, like special weekend sales offers, than monthly promotions. Read more from TaroWorks.
Management guru Peter Drucker reportedly observed, “Culture eats strategy for breakfast,” meaning that an organization’s culture is crucial for data strategy evolution.
That has been the case at organizations I have seen make the shift from data rearview mirror to data headlights. Kathleen Kelly Janus, a lecturer at the Stanford Program on Social Entrepreneurship, studied many more social entrepreneurs and reached a similar conclusion.
“Creating a data culture is critical to their success…. In my survey of 250 social entrepreneurs, organizations that began measuring their impact from the start tended to have a faster path to scale.” It’s true that “some of the most important practices of successful startups can’t be measured,” Janu notes. “But figuring out what we can measure and measuring it effectively is essential to the success of organizations that want to achieve impact.”
Editor’s Note: This blog post appeared originally on the Salesforce Foundation blog.
POST TOPICS
PREVIOUS POST
Sign up to receive emails with TaroWorks news, industry trends and best practices.
TaroWorks, a Grameen Foundation company.
Site by V+V